
Last week, I discovered myself staying up late and getting a little too excited over Excel spreadsheets.
The amount of nerdiness disgusted me at first, but I’ve come to terms with it. Data journalism jobs are in demand, and they fit into an evolving world of 21st Century media, of Wikileaks, PGP encryption, social media and SEO rankings.
Database journalism, from what I understand, is the process of analyzing data to find stories that serve the public interest. To do the job effectively, journalists need to learn a whole new toolbox of skills: Microsoft Excel, code, a bit of statistics and, *gasp* math.
But after the learning curve comes the ability to present better information to the public. Sometimes, journalism feels like parroting the he-said, she-said of politics and business.
While Mark Twain would argue “there are three kinds of lies: Lies, damned lies, and statistics,” statistics and numbers bring a logical weight to news stories, a grounding.
Last week, I googled “data journalism.” The first hit was this free e-book, created by The European Journalism Centre and the Open Knowledge Foundation.
After reading how data journalism is important for 21st Century journalism, how the marriage of the press and data has already changed the world, I skipped to the pith of the book — a step-by-step guide to doing data journalism.
And this is where I decided to get involved. It’s one thing to read how to do something, but then the skill is then mostly forgotten, unpracticed. It’s another to actually go out and do it.
So I lined up a possible project analyzing data I get on my hometown of Berlin, Conn.
The first step was to get some data.
I searched by file type (a .xls document is ideal) and I narrowed my search down until I was searching a specific website. Finally, I found something promising when I typed “2014 site:berlinpd.org filetype:pdf” into Google.
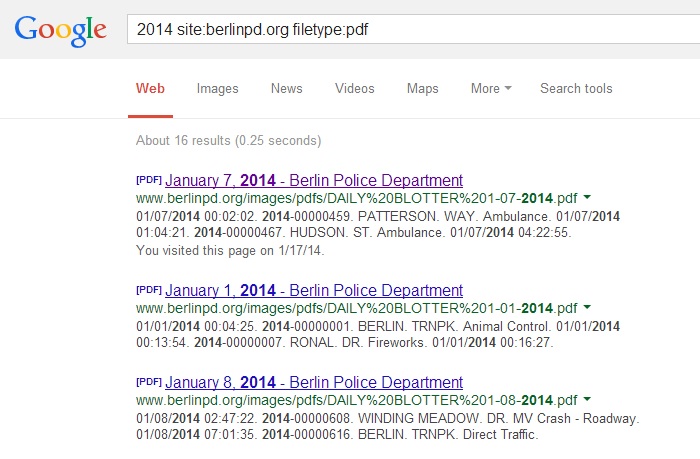
I found a promising vein of information on the Berlin Police Department’s website. They publish their daily activity blotter to the Internet in a .pdf document.
I figure I could collect data for a time and then quantify it, figuring out the most dangerous streets, what the police do on an average day, find out when the department was most busy.
There are some challenges, like converting .pdf documents to .xls pages, filling in missing data and actually making sense of it all.
Meanwhile, I will keep you updated.
P.S. Are a data journalist reading this post? Could you give me any advice? Maybe I missed a really good resource. Let me know in the comments below, or through Twitter. My handle is @jcksndnl.

One thought on “How I’m teaching myself data journalism”
Comments are closed.